Web Scraping and Agile: How Web Scraping Helps You See the Big Picture
Originally published on LinkedIn, July 2021.
Today we live in an agile world. More and more companies are adopting agile methodologies to achieve their goals, leaving cascade projects behind. Don't get me wrong, I love agile methodologies like Scrum or Lean Startup. Still, there are many times when, instead of using pure agile, it would be best to use a mix: a hybrid model that starts with a cascade project until you can begin using sprints. But companies try so hard to use agile that they don't think about hybrid models; instead, they try to achieve their goals using agile alone.
Agile is a great way to get a Minimum Viable Product (MVP) working as soon as possible. But while that product is excellent news for the customer, it can be the worst thing that happens to areas like Customer Service or Operations.
We see this when a company moves from legacy software to a new system, develops new solutions or major changes in a working product, or starts a new project.
When demand outran the data
Take the e-commerce sales of a supermarket. At the time, I was working there as an e-commerce efficiency manager. This supermarket had more than 50 sales regions, and each one had more than twenty delivery areas. The company was moving from a legacy back office to a new one to get better functions for its customers, a better understanding of every point of the process, better customer service, and a better operational experience. When the project began, e-commerce was not significant, and capacity wasn't an issue, on a typical day, demand never exceeded the capacity per region.
One of the most important reports for an e-commerce supermarket is the capacity of sales it can provide to its customers. In this case, we let customers schedule a timeframe for delivery, and we had a fixed capacity per supermarket and timeframe. The capacity is set to comply with the client's request: if the client wants their order delivered on a Monday at 17:00 because that's the only time they'll be home, we have to meet that commitment.
At that time, this supermarket used an Excel spreadsheet report, filled in manually by an analyst, to see the capacity for each timeframe and supermarket every morning. The report had the actual quantity of sales, the total capacity, and the capacity left. One unit of capacity equaled one client purchase. The analyst had to go through each sales region in the legacy software and copy the information into the Excel sheet before sending it by email. It was an expensive report, almost three hours of an analyst's time to copy and paste information that was already old by the time it was delivered.
Then the unexpected happened: e-commerce sales grew ten times in two months.
We were not prepared.
At this point, all the teams were working on the core functionality of the new back office. There was no time to build panels or give visibility, mainly because all that information lived in the old back office, and there was nothing the supermarket could do for the next year to fix that.
But there is a way to get information from a webpage and show it in a panel.
Enter web scraping
What is web scraping? Web scraping is the process of using bots, software, or scripts to extract content and data from a website. In other words, we can use software to go through the webpage, store the data we need, and then present it however we want.
flowchart LR
    S((Start)) --> A[Go into the webpage]
    A --> B[Log in with username and password]
    B --> C[Get the cookie and store it]
    C --> D[Go to the webpage with the information]
    D --> E[Get the data and store it in the database]
    E --> F{Is this the last webpage?}
    F -->|No| D
    F -->|Yes| G[Log out and finish]
    G --> Z((End))
The web-scraping loop: log in, capture the session, walk each page, store the data, repeat.
As we can see in the process, all we need to do is go to the webpage, log into it, get the cookie, go to the page that has the information, get the data, store it, and repeat. It sounds easy, and it is.
There are several ways to achieve this, depending on your software-development expertise. If you're not familiar with any programming language, don't worry, RPA is here to help you. And if you know how to code, you can easily scrape using Excel VBA, Python, Ruby on Rails, or any other language you're comfortable with. For this particular case, we chose Ruby on Rails.
Designing for the whole organization
Our main objective was to give visibility, across different levels of the organization, into how many clients we could serve, on which days, and at what times, so that each supermarket manager would have a focused view of their store, while the COO would have an aggregated view of the big picture.
Once we had the data, we defined a layout that helped us quickly understand what was happening at both an aggregate level and a specific level for each supermarket. We used color to make the status easier to read at a glance, whether we were still offering sales for a given day, whether a window had closed before reaching capacity, or whether a window was oversold.
Below is an example of how we showed the data at an aggregate level, along with a specific view for each supermarket:
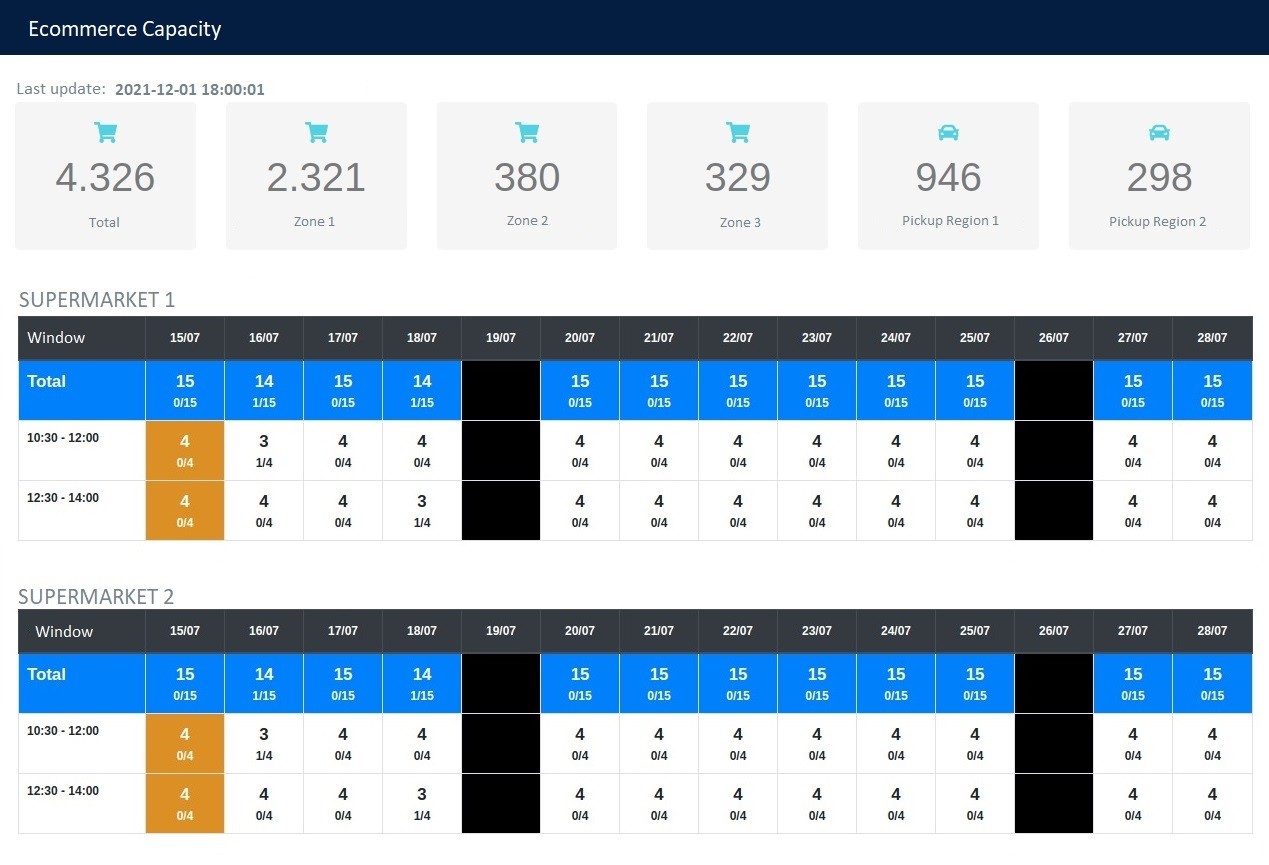
We used the size of the numbers to make the most important figures jump out for the operations team. For some, the capacity offered that day mattered most; in this case, how much was left mattered even more. It's always necessary to validate ideas with the end users, don't just tell them the idea, show it to them, so they can give you feedback and actually understand what you're talking about.
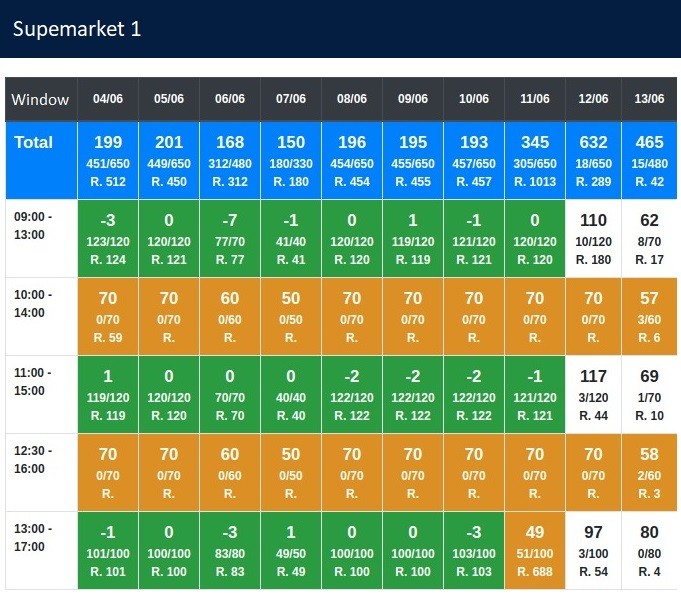
For this project, we needed about one week to get the data and build the first layouts and ways to present it. We worked closely with the end users, and with everyone else who needed the information, to show them exactly what they needed. Operations teams usually don't have much time, so any panel they use must be as clean as possible and show only what they need. Other areas need the big picture, so it's better to build a dedicated layout and keep the details for those who actually use them.
Steps to a good web-scraping report
- Understand whether the process is suitable for web scraping.
- Define the data you need.
- Define how the end user needs the data, Excel, Google Sheets, PDF, email, webpage, and so on.
- Define the periodicity, how many times a day do you need to update the data?
This was an evolving project, with incremental features every week based on new needs, so try to stay flexible. End users usually know a little better what they need, but don't be afraid to surprise them. If you have an idea, show it to them. Don't explain it; let them try it, then get their feedback. Don't worry if they don't like it, you can iterate until you get what they need.
I hope you liked it!
If you want to share thoughts, learn more about this process and its implementation, or find ways to improve or transform a process, don't hesitate to reach out.
Have you ever heard about robotic process automation (RPA) for web scraping and how to use it? Don't miss my next article.
Sebastian Undurraga is a Senior Technical Program Manager working on enterprise AI deployment. This article was originally published on LinkedIn in July 2021, early in his work on process automation and data visualization. He writes at unduslabs.com.